Go links usage data

Usage data for each individual go link is available on the homepage of your dashboard.

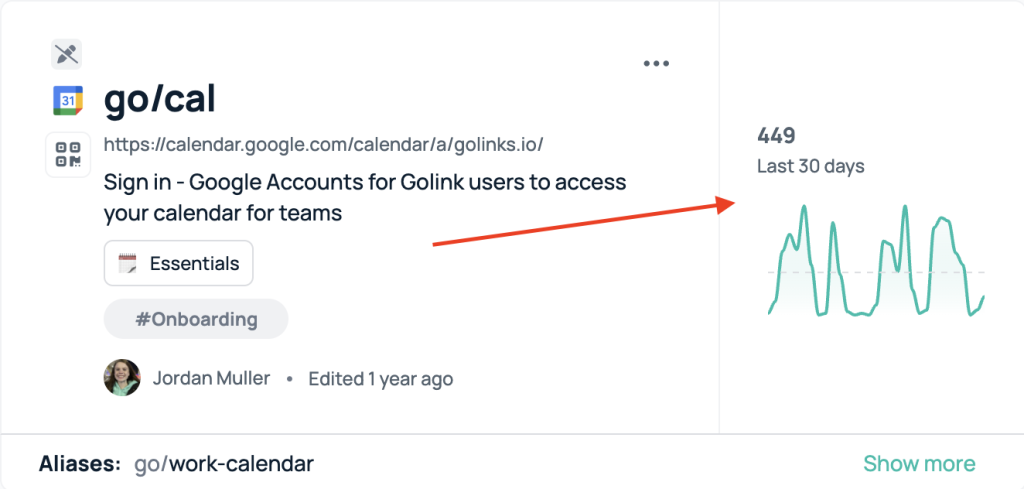
The graph displays a 30 day period of use by all team members combined with the current day at the very right of the graph. At a glance you can see what has been popular within the month and if that resource has been trending up or down.

Above the graph are three data points for total uses in a month (last 30 days), a week (last 7 days), and today (current day).

Condensed view

If you are viewing your dashboard in the condensed view, you can open this expanded view by clicking on any non-linked portion of the panel. This means anything except the link itself, the three dots, and the name of the creator. Each of these are denoted in red on the screenshot.

Only today’s statistics are available on the free tier.

Need more help?

Technical support

Send us your technical inquiries

Contact us →
Contact sales

Demo or answer sales questions

Contact sales →
Chat with us

Get quicker responses with chat

Chat now →
Blog

GoLinks and productivity articles

View blog →

Purpose-built solutions that deliver
information to your fingertips

Golinks logo
Golinks section
Memorable short links

Get to any resource instantly using memorable go links shared by your entire org.

⚡ Instant resource access
🧠️ Intuitive knowledge sharing
💡 Information discovery
✨ AI-powered suggestions
Gosearch logo
Gosearch section
Enterprise search

Search across all your content hubs from one search bar—results powered by generative AI.

🔍️ Search across all work apps
✨ AI-powered results
🤖 AI conversational chat
⚡️ 100+ data connectors
Goprofiles logo
Goprofiles section
People knowledge

Find and discover information about the people of your org. Give recognition and celebrate achievements.

🙋‍♀️️ Employee profiles
👍️ Peer recognition
📈️ Employee engagement
✨ AI-powered search