
A typical knowledge management ROI calculation seems simple: assume a standard figure, such as 30 minutes saved per employee per day, multiply by headcount and salary, and report the return. But that 30 minutes is a guess, not a measurement, so the result can’t show whether the program changed how your team finds information. This guide walks through a better approach: set a baseline, track outcome metrics, compare results against teams without a knowledge management program, and convert the difference to dollars.
Key Takeaways
- The formula: Knowledge management ROI = (attributable value − full program cost) ÷ full program cost.
- Five metrics measure the program’s value: median time to find a resource, successful retrieval rate, repeated questions, onboarding time to proficiency, and support-ticket deflection.
- Label your data. In your report, note which numbers come from system data, like logs and tickets, and which are estimates from surveys or samples.
- Use a comparison group. Before you assign a dollar value to an improvement, check whether similar teams without the program improved too, and count only the difference.
- Price time conservatively and count every cost. Put a dollar value only on time saved through actual usage, priced at an employee’s full hourly cost. Then include every program cost: licenses, implementation, administration, and maintenance.
What Knowledge Management ROI Measures (and What It Doesn’t)
Knowledge management ROI compares what a program returns with what it costs:
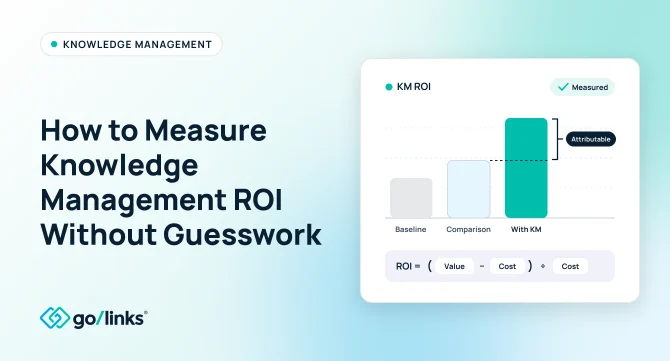
ROI = (Attributable value − Full program cost) ÷ Full program cost
Your result is only as accurate as the two numbers you plug in: attributable value and full program cost.
Attributable value counts, in dollars, only the improvements that come directly from your knowledge management program, not every improvement that happened after launch. If a reorg cut a reporting step in the same quarter you launched your program, the program doesn’t get credit for that time. Broad estimates like “each employee saves two hours a week” don’t meet this standard. They’re based on estimates, and they don’t account for other factors that could explain the change.
Full program cost is everything you spend to run the program: software licenses, setup and migration, ongoing administration, and maintenance. Include staff time too, so the cost side is complete.
General productivity claims about the benefits of knowledge management tend to inflate the value and leave out costs. The steps below show how to fill in both sides of the formula with real data. For background on building the program, see the four stages of a knowledge management process.
How to Measure Knowledge Management ROI in 5 Steps
These five steps turn the ROI formula into a repeatable process: define what to measure, set a starting point, separate your program’s impact from everything else, put a dollar value on the results, and account for every cost.
Step 1: Choose and Define Your Outcome Metrics
Start by choosing what to measure. The five metrics below use data from tools you likely already have, such as search logs, a help desk, an HRIS, and Slack or Teams. Use them as a starting point, and swap in others if they fit your program better.
| Metric | How it’s measured | Data source | Evidence type |
|---|---|---|---|
| Median time to find a resource | Minutes per lookup | Search or link analytics, or a timed task sample | Observed (analytics) or estimated (sample) |
| Successful retrieval rate | % of total searches or link requests | Search logs, link “not found” reports | Observed |
| Repeated questions | Questions per 10 employees per month | Tagged sample of Slack or Teams help-channel threads | Estimated (manual sample) |
| Onboarding time to proficiency | Days per new hire | HRIS start date plus a defined milestone | Observed |
| Support-ticket deflection | % change in tickets per employee per month, documented categories only | IT or HR help desk | Observed |
Median time to find a resource. Start with your search or link analytics, which may already track how long it takes people to reach a resource. If your tools don’t capture this, ask a few employees to find five to 10 common resources, like the expense policy or the latest sales deck, and time each search. Use the median, since one long search can skew an average, and report sampled results as estimates.
Successful retrieval rate. Divide the number of searches that end at the right resource by total searches. A click counts as a success. No click, a “not found” result, or a follow-up question in a help channel counts as a miss. Your system logs track this automatically.
Repeated questions. Each month, review a sample of help-channel threads and count questions your documentation already answers. Report the count per 10 employees so headcount changes don’t skew the trend.
Onboarding time to proficiency. Pick one milestone per role, like a first solo customer call or a first merged pull request, and count the days from start date to reach it. Keep the milestone the same throughout.
Support-ticket deflection. Count IT and HR tickets per employee each month in categories your documentation covers, like password resets or VPN setup. Use tickets in other categories as a baseline.
System metrics take little extra work. For estimated metrics, note the sample size and method next to each number.
Step 2: Set Baselines and Reporting Windows
To measure change, you first need a reliable starting point.
- Match windows. Compare periods of the same length, such as eight weeks before launch and eight weeks starting a month after. Skip the first month to keep the launch-week spike out of your results.
- Avoid seasonal distortion. Don’t compare a slow holiday December with a busy February, or a hiring surge with a hiring freeze. When possible, compare the same weeks year over year.
- Set a minimum sample size. Collect enough data to see a clear pattern before you report a result. A handful of timed searches or a single month of tickets isn’t enough. If a result flips back and forth between periods, treat it as noise.
- Report on a fixed cadence. Quarterly reports smooth out weekly swings and line up with budget planning.
No historical baseline? New tools, teams, and hires don’t have one. Use the first two to four weeks after launch as your baseline and measure from there, noting that it may already reflect some early impact. For onboarding, compare against the last group hired before launch.
Step 3: Use a Comparison Group to Measure Your Program’s Impact
Results that improve after rollout don’t demonstrate the program caused the change. A comparison group helps you confirm.
Keep the setup simple. Launch the program with one or two pilot teams first. Pick comparison teams of a similar size, function, and tool set, and track the same metrics for both groups over the same periods. To find the program’s real effect, subtract the comparison group’s change from the pilot group’s change. What’s left is the improvement the program caused.
For example, if the pilot group’s time to find drops by 2 minutes and the comparison group’s drops by 0.5, the program gets credit for 1.5 minutes.
Watch for outside factors. Track anything else that could affect your results:
- Hiring or layoffs
- Other tool launches in the same period
- Seasonal swings, like open enrollment or year-end
- Team makeup, such as a pilot team of early adopters
Leave out results that don’t hold up. If the pilot and comparison groups improve by about the same amount, the program didn’t cause that change, so leave it out of your ROI. Note what you excluded and why. Showing your exclusions makes the final number more credible.
Step 4: Convert Time Saved Into Dollars, Conservatively
Use a loaded labor rate. An hour of work costs more than salary alone. A loaded rate adds benefits, payroll taxes, and paid leave. Bureau of Labor Statistics data shows employers paid an average of $54.00 per hour worked for full-time private industry workers in June 2026, and benefits make up about 30% of that cost. Ask your finance team for the rate that fits the roles you’re measuring, since knowledge workers often cost more than average.
Count only actual usage. Multiply the minutes saved per search by the number of searches people actually ran, not by headcount times a guessed number of daily searches. If 150 of 250 employees use the system, count only those 150.
Annual time value = active users × searches per week × minutes saved ÷ 60 × working weeks × hourly rate
Separate time savings from cost savings. Saved time frees up capacity, but it doesn’t cut payroll unless the company puts that time to other use. Report time-based value as capacity, and list hard savings, such as fewer contractor support hours, separately.
Avoid double-counting. One action can show up in several metrics. If an employee finds the VPN guide instead of filing a ticket, that counts as a successful search, a faster find, and a deflected ticket. To count it once:
- Value time to find based on the employee’s time.
- Value ticket deflection based on the support team’s time only.
- Track retrieval rate and repeated questions without a dollar value.
Step 5: Total the Full Program Cost
Include every cost below. Leaving one out makes the ROI look better than it is.
| Cost line | What to include | How to price it |
|---|---|---|
| Licensing and subscriptions | Seats, add-ons, premium tiers, connectors | Annual contract value |
| Implementation and migration | Content migration, integration setup, SSO, training sessions | Hours × loaded rate, plus any services fees |
| Ongoing administration | Permissions, provisioning, analytics review, governance meetings | Hours per week × working weeks × loaded rate |
| Maintenance and support | Content owner updates, link and page audits, vendor support | Hours per month × 12 × loaded rate |
Use the same hourly rate on both sides of the formula. If you value time saved at the loaded rate, value admin time at the loaded rate too. Using a lower rate for costs, or leaving admin time out, makes the ROI look higher than it is. Finally, decide whether to count implementation as a one-time, first-year cost or spread it across the contract, and apply that choice the same way every time you report.
Sample Knowledge Management ROI Calculation for a Mid-Size Company
To see how the five steps work together, here’s a complete calculation for a fictional company, from raw inputs to final ROI. The figures are hypothetical and illustrate the method; they do not represent industry benchmarks.
Scenario: A 250-employee software company pilots a knowledge management program with two teams for one quarter, using two similar teams as a comparison group. Following the pilot, the company deploys the program company-wide. The figures below reflect the first full year after deployment.
Inputs and Where They Come From
| Input | Value | Evidence type |
|---|---|---|
| Active users | 150 of 250 employees (60%) | Observed (usage logs) |
| Searches per active user per week | 10 | Observed (usage logs) |
| Attributable time saved per search | 1.5 minutes (pilot −2.0, comparison −0.5) | Estimated (timed sample) |
| Working weeks per year | 46 | Company policy |
| Loaded hourly rate | $54 | BLS full-time private industry average, June 2026 |
| Baseline tickets in documented categories | 2,000 per year | Observed (help desk) |
| Attributable ticket reduction | 15% (pilot −20%, comparison −5%) | Observed (help desk) |
| Support handling time per ticket | 20 minutes | Observed (help desk) |
The Calculation
The table below plugs those inputs into the ROI formula to show first-year value, total cost, and the resulting ROI.
| Line item | Calculation | Annual amount |
|---|---|---|
| Time to find | 150 users × 10 searches × 1.5 min ÷ 60 × 46 weeks × $54 | $93,150 |
| Ticket deflection (support time only) | 2,000 tickets × 15% × 20 min ÷ 60 × $54 | $5,400 |
| Total attributable value | $98,550 | |
| Licenses | Illustrative annual contract | $18,000 |
| Implementation and migration | 80 hours × $54 | $4,320 |
| Ongoing administration | 4 hours/week × 46 weeks × $54 | $9,936 |
| Maintenance | 10 content owners × 1 hour/month × 12 × $54 | $6,480 |
| Total program cost | $38,736 | |
| ROI | ($98,550 − $38,736) ÷ $38,736 | 154% |
To keep the result conservative, the calculation leaves two metrics out of the total. Onboarding time doesn’t count because the pilot teams hired only six people, and the comparison group improved about as much. Repeated questions don’t get a dollar value because they overlap with time to find and ticket deflection.
Sensitivity Range
ROI shifts a lot with your assumptions, so show a range instead of a single number.
| Case | Adoption | Minutes saved per search | Program cost | ROI |
|---|---|---|---|---|
| Conservative | 40% | 1.0 | $38,736 | 16% |
| Mid | 60% | 1.5 | $38,736 | 154% |
| Optimistic | 80% | 2.0 | $38,736 | 346% |
Adoption and time saved drive nearly all of the difference. (Ticket reduction also varies, from 10% to 20%, but barely moves the result.) In leadership reviews, open with the conservative case and share the full range.
7 Mistakes That Inflate Knowledge Management ROI
Before you share your numbers with stakeholders, check them against this list:
- Counting estimated time as actual savings. Did you base the time value on observed usage, not headcount multiplied by an assumed number of searches?
- Skipping the comparison group. Did you check whether teams without the program improved by a similar amount?
- Leaving out costs. Did you include implementation, administration, and maintenance time alongside licenses?
- Double-counting. Did you avoid assigning a dollar value to the same behavior more than once across retrieval rate, time to find, and ticket deflection?
- Mixing labor rates. Did you apply the same loaded rate to both time saved and admin time?
- Reporting a single number. Did you show a range of outcomes instead of one ROI figure?
- Leaving estimates unlabeled. Did you note which inputs came from samples, surveys, or vendor-reported figures?
How GoLinks Supplies the Usage Data Behind Your ROI
GoLinks doesn’t calculate ROI on its own. It gives your team one place to reach resources across its apps and captures the usage data you need to track the metrics you’ve defined.
What the analytics show:
- Workspace analytics (Pro and Enterprise plans) show most-used and newest go links, go links created and used, usage by role, popular tags, commonly searched terms, and top not-found terms.
- Personal analytics show each user’s recent and top go links, link creation rate, and applications used.
- Hot and new links, top used apps, and the “ROI using GoLinks” module show which resources and tools teams rely on, and estimate time saved based on company-wide usage.
How the data maps to your metrics:
- Successful retrieval rate: Top not-found terms show where searches fail. Track them as a share of total searches, and create links for the ones that keep coming up.
- Time to find: Go link usage counts give you the actual-usage number from Step 4. Pair them with your own timed sample to get minutes saved per search.
- Program cost context: Top used apps and newly discovered apps show which tools your teams rely on, which helps you decide what belongs in the program.
Treat GoLinks time-saved figures as product estimates. Use them to spot trends, not in place of your comparison-group results.
Make Knowledge Management ROI a Measurement Habit
A credible knowledge management ROI number comes from measuring consistently, not from a one-time calculation. Set your baselines, keep a comparison group in place, update the numbers every quarter, and lead with the conservative case. That way, when finance asks how you got the number, you can show them.
Knowledge management delivers real returns, but you need the right tools to capture them. Book a GoLinks demo to see how GoLinks tracks the usage behind your ROI, from the resources your team relies on most to the searches that come up empty.
Access and share resources instantly with GoLinks
Schedule a demo